

Elixier Data Platform
Elixier - Mix of right doses of data technologies, data engineering, data literacy and data value appreciation solution to help our clients to be Data-Driven ready...!
Speed, Scalability and Security are the needs of Data-Driven organizations today. Elixier reference architecture for Data Platform is based on open standards and open source innovations. Elixier Data Platform addresses the constraints of traditional data-lakes or data warehouses that are faced by Enterprises and Govt organizations. Elixier leverages on container technologies to flexibly cater for today's use-cases that are resource-intensive and short-lived. Very often, businesses need urgent data needs and use cases that need resources to be scaled up and down as flexibly as required. Elixier Data Platform architecture takes into account scalability, reliability, security, performance and cost savings.
Data Pipeline Management
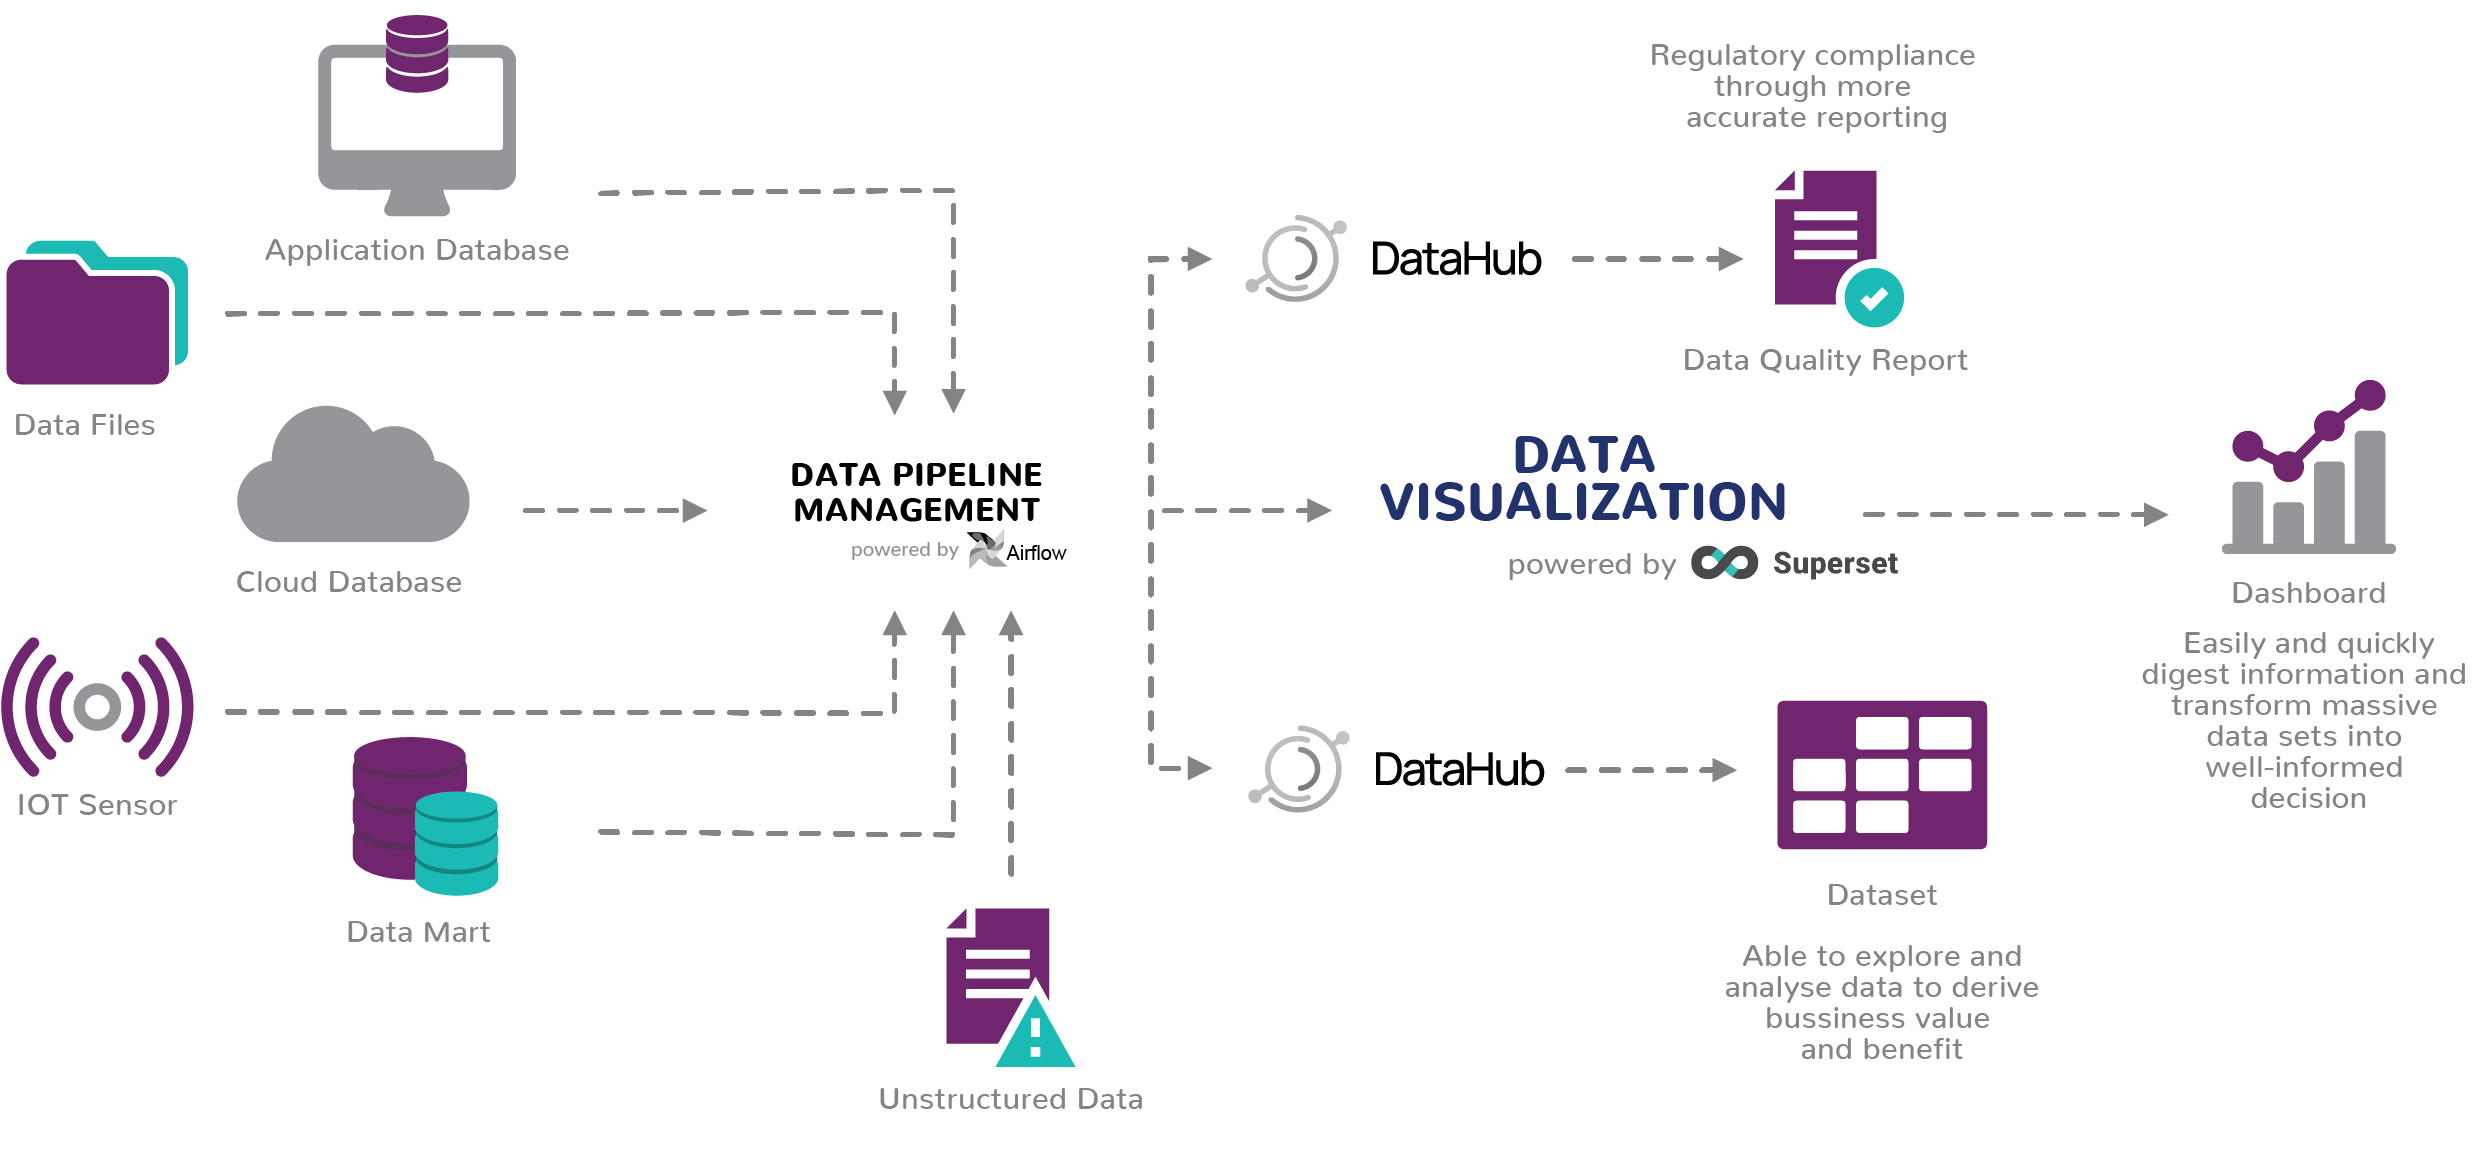
DATA PIPELINE MANAGEMENT - With huge amounts of data being
generated every second from
business transactions, sales figures, customer logs, and stakeholders, data is the fuel that
drives companies. The exponential growth of data has made it a challenge for businesses to
effectively handle the increased users, data volume, and data complexity.
Data Pipeline Management is an excellent tool to seamlessly organize, execute, and monitor data
workflows. Data Pipeline Management provides a platform for scheduling and monitoring workflows
which is
useful in architecting and orchestrating complex data pipelines.
Data Pipeline Management is cloud-ready and it is highly flexible as it is designed to work within
an
architecture that is standard for nearly every software development environment. Due to its
flexibility and robustness, Data Pipeline Management could be used as a powerful workflow
management
platform.
Open-source Task Scheduler
Allows users to programmatically author, build, monitor, and share work- flows in the cloud
Create & Track Data Flows
Allows users to create workflows with high granularity and track the progress as they execute
Manage Data Flows
Provides tools that make it easier to manage data-flows and data processing steps in an integrated manner
Architecture
Useful User Interface
Monitor, schedule and manage your workflow via a robust & modern web application
Automation
Automate processes, fetching data, machine learning pipelines, data transfer, and monitoring
Modern Architecture
Highly scalable leveraging the power of your existing data infrastructure
Easy-to-use
With Python knowledge easily build machine learning models, transfer data, & manage your infrastructure
Robust Integration
Provides many plug-and-play operators, easy to apply to current infrastructure and extend to next-gen tech
Powerful Tool
Powerful business intelligence tool with flexible data visualization options
Data Visualization
DATA EXPLORATION & VISUALIZATION - Many businesses are falling short
by lacking a clear
understanding
of their data and its business value. Without the right tools to visualize the data, operational and
business leaders may fail to correct and optimize their strategies on the go.
With Data Visualization, easily transform massive data sets into actionable insights. The
powerful, fully customisable graphical chart and dashboard development interface can be adapted to
convert raw data into decision-ready information. Data Visualization is a cloud-ready,
web-based
application that can effortlessly integrate with an extensive data source support - PostgreSQL,
MySQL, Oracle, MSSQL, Hive, Elastic- Search, Druid, and cloud databases. Data Visualization
is
equipped with extensive list of supported chart types which offers decision-makers meaningful ways
to discover relationships and patterns between business and operational activities. Underpinned by
In-memory OLAP engine for fast exploratory analytics powered by Apache Druid, users can easily
discover insights and business intelligence quicker than ever before.
Combining both advanced technical capabilities and easy-to-use features, Elixier Data
Visualization’s
flexible and robust abilities will help you connect the dots and uncover the true value of your
datasets.
Explore & Visualize
Make it easy to slice, dice and visualize data
View
View your data through interactive dashboards
Investigate
Use SQL Lab to write queries to explore your data
Architecture
Web-based
User-friendly web-based application
Smart Dashboards
Multiple views of data to get richer insight
Modern Architecture
Highly scalable leveraging the power of your existing data infrastructure
Ease of Use
Easy-to-use interface for exploring and visualizing data
Seamless Integration
Connect to any SQL based data source through SQL Alchemy
Powerful Tool
Powerful business intelligence tool with flexible data visualization options